|
|
||
|
The concept of visualization stands out as a powerful tool for driving efficiency, accountability, and continuous improvement in lean thinking. By creating visual controls within processes, organizations make standards and abnormalities visible and foster a culture of transparency and adherence to standardized work. There are so many different ways to implement visual controls that there is really no one "right" way. It all depends on the process you are working with, your facility, and your goal prioritization.
Similar to what we have discussed in "Lean Beyond Limits: Unleashing Lean Thinking Across Industries," visualization is not just for manufacturing. Implementing visual controls across various processes requires careful consideration of each environment's specific needs and dynamics.
Colour Coding: Assigning specific colours to different items, areas, or tasks can help visually distinguish between them and convey important information at a glance.
Short side tangent on visual boards!I am often asked if it's possible to use virtual visual boards. While it is possible, and many different software out there allow you to do this, I always try to caution people against the bells and whistles of these digital alternatives. Technology is amazing in many different ways, but in my experience, the good old-fashioned whiteboard is hard to beat! A key reason these boards work is that they are always in your face. They are hard to ignore, as they take up room on the floor, in hallways, offices, and breakrooms. When you digitalize display boards, while getting reminders on your phone or through email is possible, we quickly become overwhelmed and stop looking at all those notifications. In that regard, a whiteboard is more passive than the constant, endless stream of digital notifications you are likely already inundated with. Yet the whiteboard is tangible and large enough that it is a constant visual reminder of your team's progress and goals. Another critical reason I advocate against digital systems is they are often expensive and slow to change. In today's dynamic team environment, visual boards must be easy and quick to change on the fly. If something isn't working the way you need, or you need to track something else or track it differently, all you have to do is erase it or get a new sticky note.
Benefits of Visual Controls
Now that we understand how to implement visual controls, it's time to discuss the benefits of doing so. When it comes to things like 5S and creating visual control, some teams, and particularly type A leaders like myself, may take visual controls a little too far! Once you get on that train, it can be difficult to get off.
You don't need to go as far as taping out your desk! By this point, in my opinion, visual controls have gone from being useful tools to a time-consuming hindrance. On the other hand, many are intimidated by implementing visual controls, probably because their only experience with visualization is in the photo above. YIKES! How can visualization assist us in keeping our standards in check and our processes on track?
Visual Controls: Bringing Standards and Abnormalities to LightAt the heart of lean thinking lies the pursuit of eliminating waste and optimizing processes. Visual controls serve as a cornerstone in achieving these objectives by making key information readily accessible to all stakeholders. Whether through colour-coded labels, Kanban boards, or Andon systems, visual cues provide immediate feedback on the status of operations, enabling quick decision-making and problem-solving.
Enhanced Accountability Visualization promotes accountability by making standards and deviations from them clearly visible to everyone involved in the process. When standards are visually represented, employees have a tangible reference point for their work, reducing ambiguity and ensuring consistency. Likewise, abnormalities are promptly identified through visual cues, prompting swift corrective actions and preventing issues from escalating.
Maintaining Standards and Standardized Work One of the fundamental principles of lean thinking is the establishment of standardized work procedures. Visualization plays a pivotal role in maintaining these standards by providing visual cues that guide employees in performing their tasks consistently and efficiently. By making standardized work visually explicit, organizations mitigate the risk of variation and deviation, ultimately enhancing quality and productivity.
Driving Continuous Improvement Visual controls not only facilitate adherence to existing standards but also serve as a catalyst for continuous improvement. By making abnormalities visible, organizations are prompted to investigate root causes and implement countermeasures to prevent recurrence. Moreover, visualizing key performance metrics and progress toward goals empowers teams to track their performance in real time and identify opportunities for further optimization.
Cultivating a Culture of Excellence
Incorporating visualization into lean practices goes beyond improving operational efficiency—it fosters a culture of excellence and empowerment. When employees can visually see the impact of their actions on performance metrics and outcomes, they feel a sense of ownership and pride in their work. Moreover, the transparency afforded by visual controls promotes collaboration and collective problem-solving, driving organizational success.
The following are case studies showcasing different approaches to implementing visual controls in manufacturing, an office setting, and a web company:
1 Medical: Colour-Coding
Case Study: Family Doctors Office
Implementing visual controls can significantly enhance productivity and quality in a doctor's office. I was pleasantly surprised recently when I went in for my yearly checkup and found that the office had been colour-coded. This particular doctor's office has several different family Doctors, as well as specialized tests and immunizations. Each patient was checked in at the front desk and then assigned a seat colour: blue for sample collection, green for family doctor, and red for bloodwork.
At one glance, it was easy to see how many people were waiting for each procedure, allowing the office to take any additional measures to reduce wait times.
2. Office Setting: Visual Management Boards
Case Study: Marketing Firm
Maintaining visibility and alignment across teams is essential in a marketing firm where multiple projects are ongoing simultaneously. Visual management boards offer a solution by providing a centralized space to display key project metrics, milestones, and task assignments in a visually intuitive format. The marketing firm implements visual management boards prominently displayed in communal team areas. Each board represents a specific project and includes sections for tasks, timelines, and progress updates. Team members use colour-coded sticky notes or magnets to indicate task status, with green representing completed tasks, yellow for in-progress tasks, and red for tasks at risk or delayed. By visualizing project status and performance metrics, teams can quickly identify areas needing attention and take proactive measures to address challenges. Moreover, the transparency afforded by visual management boards fosters communication, collaboration, and accountability among team members, driving project success.
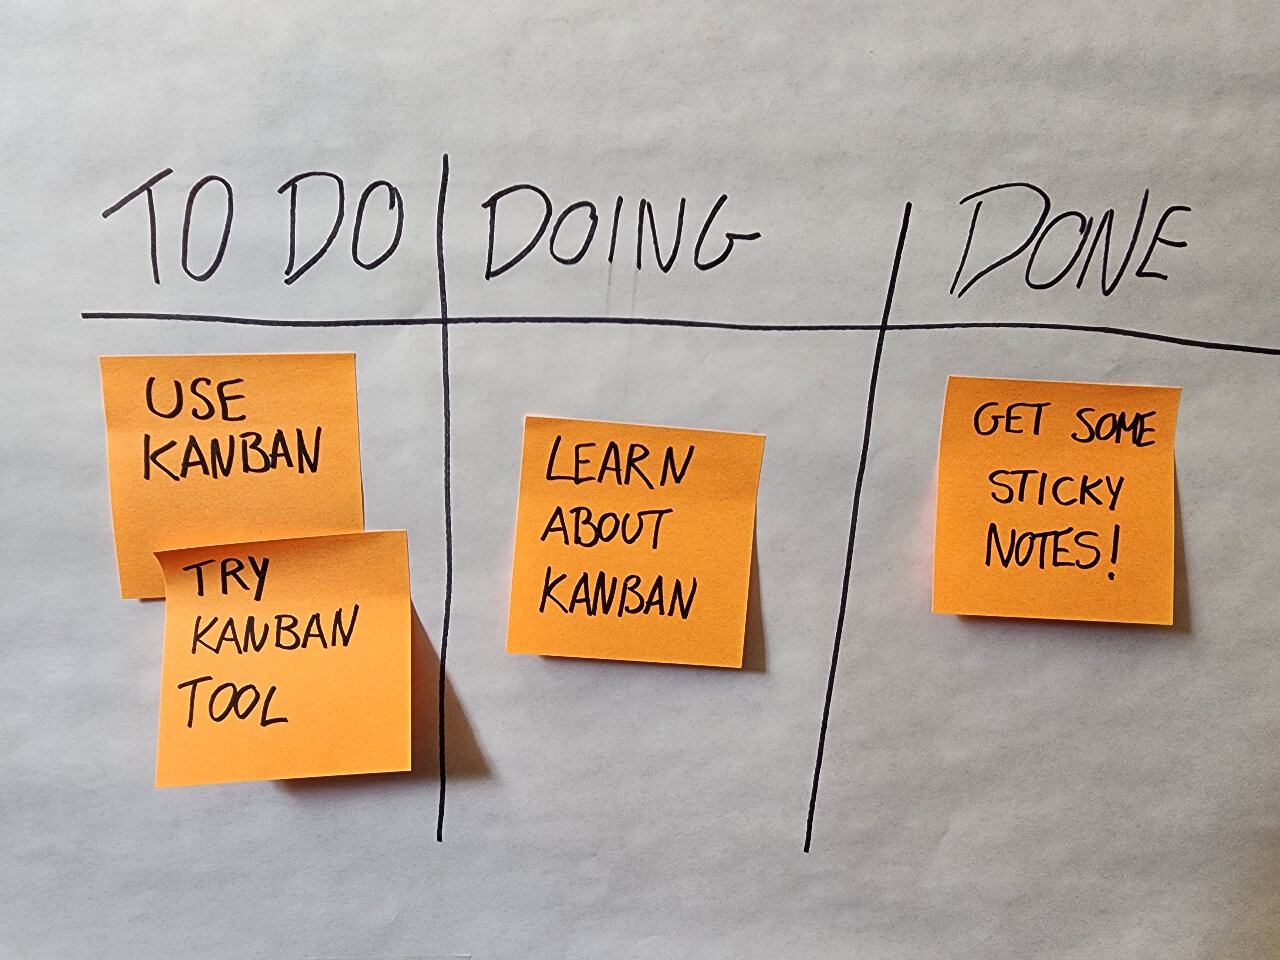
3. Web Company: Kanban System for Software Development
Case Study: Tech Startup Agility and efficiency are critical for staying competitive in a fast-paced web company specializing in software development. Implementing a Kanban system offers an effective way to visualize workflows, manage tasks, and optimize the development process.
The tech startup adopts a Kanban board to track the progress of software development tasks. The board consists of columns representing different stages of the development lifecycle, such as backlog, development, testing, and deployment. Each task is represented by a card colour with relevant details such as task description, assignee, and due date.
Team members move task cards across the board as they progress through the workflow, providing a visual representation of work in progress and bottlenecks. Additionally, colour-coded labels or tags may indicate task priority or type, allowing teams to prioritize and allocate resources effectively.
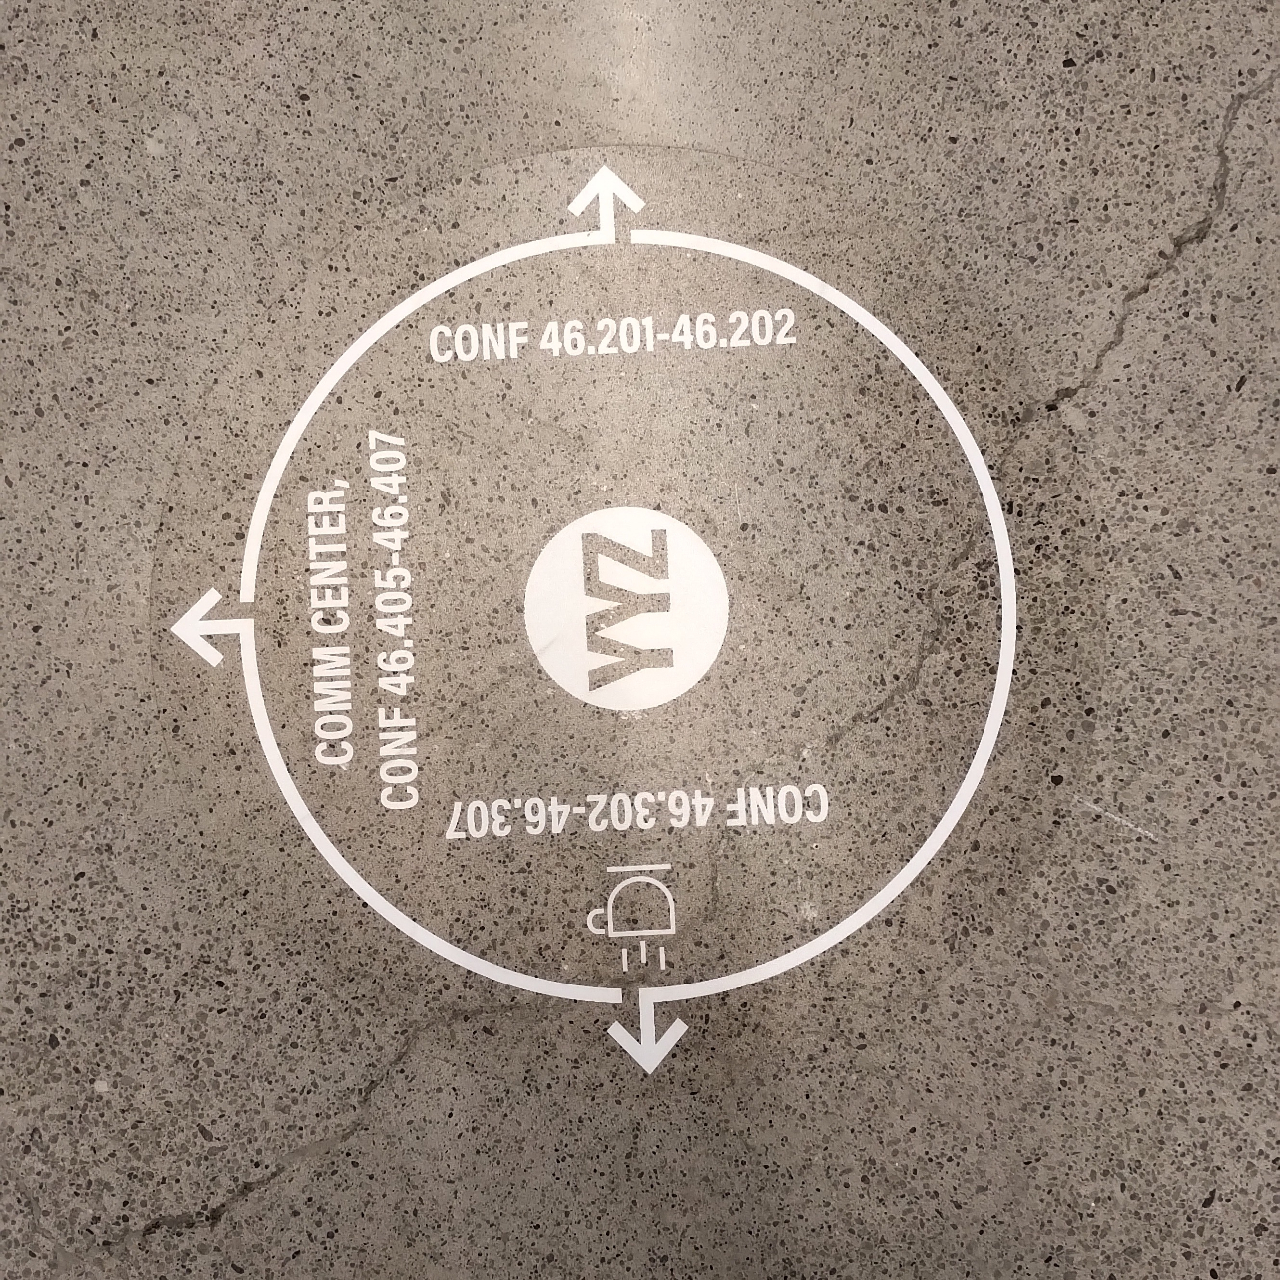
The concept of visualization is a powerful tool in lean thinking, driving efficiency, accountability, and continuous improvement. By implementing visual controls within processes, organizations make standards and abnormalities visible, fostering transparency and adherence to standardized work. There are numerous ways to implement visual controls, each tailored to the specific needs and dynamics of the environment. For instance, colour coding can help distinguish between items or tasks, while floor markings and signage guide people through spaces and communicate safety information. Checklists and visual work instructions ensure consistency and accuracy, and Kanban systems optimize workflows in various industries. Visual metrics dashboards provide real-time performance tracking and improvement insights. While virtual alternatives exist, traditional whiteboards remain effective due to their constant visibility and tangible presence. Visual controls promote accountability, maintain standards, drive continuous improvement, and cultivate a culture of excellence within organizations. Case studies across manufacturing, office settings, and web companies demonstrate the diverse applications and benefits of visual controls. |
||
|
||
|
||
|
|
|
|
HPL Administrator 7 November 29, 2024 |

|
|
Sabrina Sommerville 1 August 15, 2024 |

|
|
Glenn Sommerville 45 June 6, 2024 |