|
|
||
|
We had a great turn-out and received very positive feedback at our last Lunch & Lead Series on the topic of "Leading Problem Solving", however, we also received some comments that it was difficult for those in non-manufacturing spaces to relate to how they can lead problem solving in their area. Over the next few posts, we'll cover off the topics from the Lunch and Lead Series but with a non-manufacturing focus.
If you missed the Lunch & Lead Series, it is available free at our on-line content site here as a “course” but don’t let the terminology fool you, it is just the video recording of the event, divided up into smaller duration “lectures” that correspond to each of the agenda items. Go check it out…
The first topic was the establishment of standards that within a very short period of time, as in a few seconds, anyone can determine if something is normal or abnormal. As in manufacturing, visualization of some standards in non-manufacturing areas are relatively easy. These are the things that when out of standard negatively impact the team’s ability to do their work.
Other examples could be as simple of establishing standards around team supplies, tooling, or equipment.
In non-manufacturing areas the challenge often is that the “work” and “work flow” is not overly visible. For example, an engineering project is comprised of various tasks that engineers need to complete. The challenge here is that often with development type work, the engineers are dealing with a lot of unknowns or because it maybe the first time creating “something” there are no standards for it. In these cases, you want to establish standards around the work flow, provide a framework of generally accepted principles or benchmarks, and provide clear escalation mechanisms when things are not going as expected or planned. An effective way to visualize these is through a visual control board.
In the first example we will use a technical team that is responsible for completing some type of project type work. This could be product design, tooling or test equipment design, or construction/fabrication.
The layout of the board would be done in such a manner as to indicate the tasks that need to be completed by whom within a “standard” period of time. These standards could be industry standards, standard times as determined by the organization, benchmarks, or in the case of creative/innovative never been done before work, best guess estimations or established service level agreements (SLAs). It can also be with reference to the project milestones. Often, there is a strong reluctance to do this because of the “unknowness” of how long it should take to complete these tasks, however, referencing to the milestones allows for faster visibility of potential project delays or impacts. This should not be used to place blame or put undue pressure on those involved, but rather, provide the opportunity for escalation that can lead to additional resources, rescheduling of downstream tasks, and/or important communication of the status of the project to critical stakeholders.
Typically this would be visualized by day for a 1 to 2 week window for each person assigned to the project within a specific team. The board can be either physical or virtual board as long as the task assignments by day by week can be displayed. Each day the board is reviewed by those working on the tasks and their next level up leader. At the daily review, abnormalities to the standards would be very visible indicating a task is behind or that there has been some kind of difficulty or risk associated with it identified.
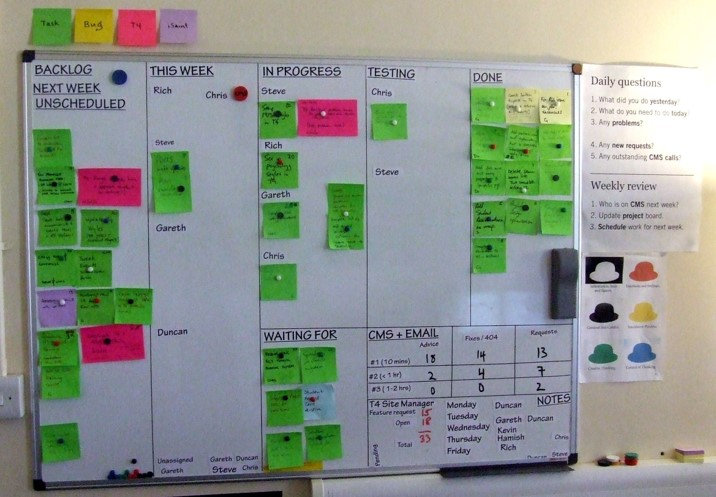
A pareto of issues can be created and built each day to help the team focus on the biggest issues that impact their work. Often in these types of situations, unplanned work plays a key role and has a significant impact on the teams ability to complete their project(s). Using a different colour sticky in this case to indicate unplanned work is very visual and can easily be tracked in the pareto as an issue. The leader can then assist the team in quickly resolving the issue through problem solving. The problem solving should not occur at the meeting, but rather a commitment made between the appropriate stakeholders as to what the next steps are and by when.
In the second example we’ll review a procurement situation. Typically a procurement team’s work flow is within a computer system. However, critical information is also usually available within those same systems. Again using a visual board and placing critical reports on them with visualization of abnormalities to standards is a good approach. For example, perhaps there are SLAs as to how long it should take for a purchase order (PO) to be placed. An aging report or having each buyer indicate which of their purchase requisitions (PR) are out of that standard helps to visualize purchasing abnormalities. Unfortunately, too often, we can experience payment problems to our vendors and then get ourselves into trouble when they refuse to continue to ship. Then talk about abnormal work to clear that up! Perhaps a metric that shows outstanding payment aging would be beneficial to avoid such situations. Again the abnormalities can be tracked in a form of a pareto for deeper analysis and problem solving. The point is to identify the aspects of the teams workflow that can or is having the biggest impact on their ability to effectively do their job or on the organization.
A third example is for a sales and marketing team. They can visualize their work flow on a visual board and meet daily to review. They could visualize main proposal work content and status. Discuss new risks that arise that may pose a threat to winning the project, as well as visualizing the probability of a win and the financial status of the sales plan vs actual. They can also capture lessons learned to improve their quoting and proposal process to drive continuous improvement, as well as to quickly identify abnormalities or issues that could impact a proposal so that problem solving is quickly initiated and/or escalated. Although non-manufacturing work tasks are less naturally physically visible, the same principles apply.
Controls could include variance to SLAs, escalation mechanisms, layered process audits to confirm standards and identify areas needing focus, for example.
In the next post, we’ll discuss how TIM WOODS can apply to non-manufacturing areas.
|
||
|
||
|
||
|
||
|
|
|
|
HPL Administrator 7 November 29, 2024 |

|
|
Sabrina Sommerville 1 August 15, 2024 |

|
|
Glenn Sommerville 45 June 6, 2024 |

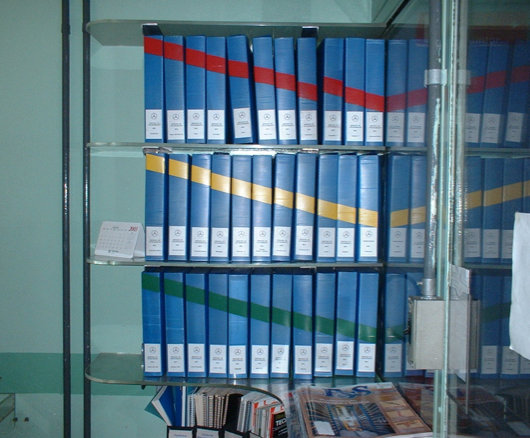 Examples could include a common reference library of regulations, policies, or other documented information. Being able to quickly find what you’re looking for or identifying any that may have been misplaced can prove very helpful, save time, and reduce frustrations. In the virtual world, similar standards are useful for organizing digital storage by establishing standard file structures and nomenclature.
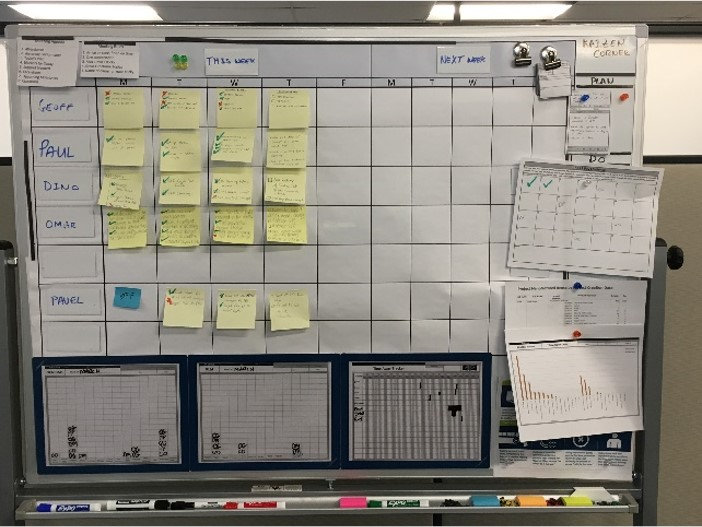
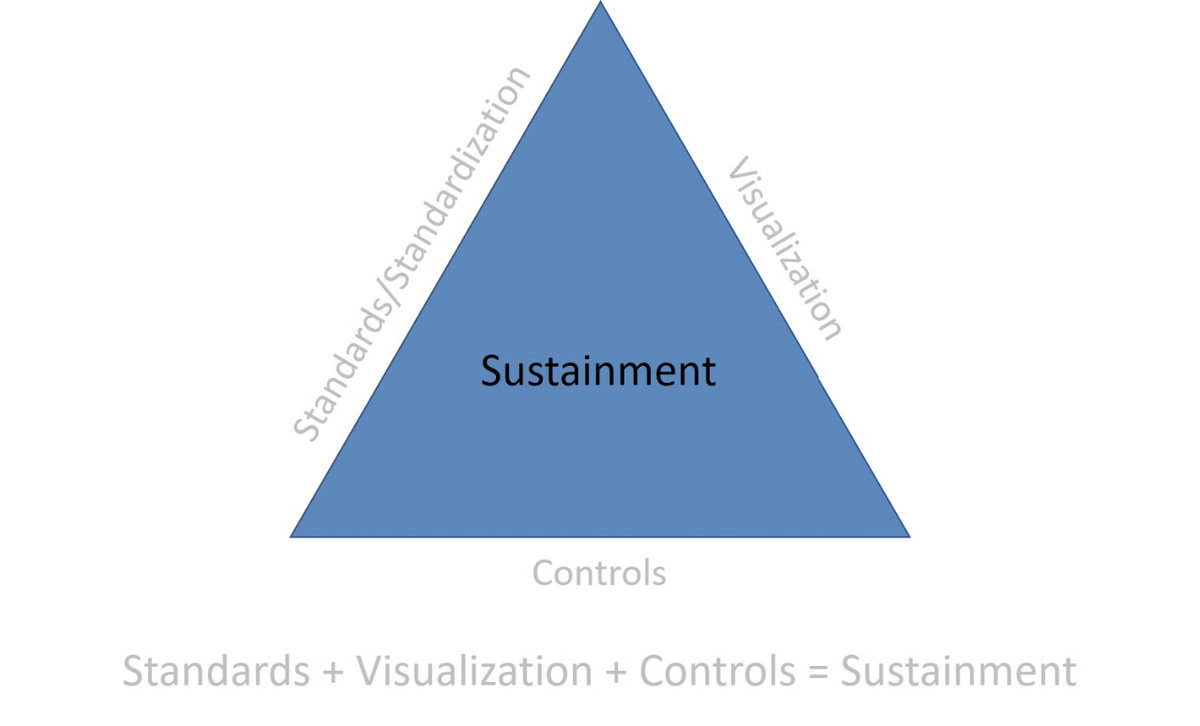 You need to establish the standards the team is to follow, make them visible in some manner usually through a visual board, and then there needs to be some form of controls in place to manage and problem solve through the abnormalities.