|
|
||
|
The concept of visualization stands out as a powerful tool for driving efficiency, accountability, and continuous improvement in lean thinking. By creating visual controls within processes, organizations make standards and abnormalities visible and foster a culture of transparency and adherence to standardized work. There are so many different ways to implement visual controls that there is really no one "right" way. It all depends on the process you are working with, your facility, and your goal prioritization.
Similar to what we have discussed in "Lean Beyond Limits: Unleashing Lean Thinking Across Industries," visualization is not just for manufacturing. Implementing visual controls across various processes requires careful consideration of each environment's specific needs and dynamics.
Colour Coding: Assigning specific colours to different items, areas, or tasks can help visually distinguish between them and convey important information at a glance.
Short side tangent on visual boards!I am often asked if it's possible to use virtual visual boards. While it is possible, and many different software out there allow you to do this, I always try to caution people against the bells and whistles of these digital alternatives. Technology is amazing in many different ways, but in my experience, the good old-fashioned whiteboard is hard to beat! A key reason these boards work is that they are always in your face. They are hard to ignore, as they take up room on the floor, in hallways, offices, and breakrooms. When you digitalize display boards, while getting reminders on your phone or through email is possible, we quickly become overwhelmed and stop looking at all those notifications. In that regard, a whiteboard is more passive than the constant, endless stream of digital notifications you are likely already inundated with. Yet the whiteboard is tangible and large enough that it is a constant visual reminder of your team's progress and goals. Another critical reason I advocate against digital systems is they are often expensive and slow to change. In today's dynamic team environment, visual boards must be easy and quick to change on the fly. If something isn't working the way you need, or you need to track something else or track it differently, all you have to do is erase it or get a new sticky note.
Benefits of Visual Controls
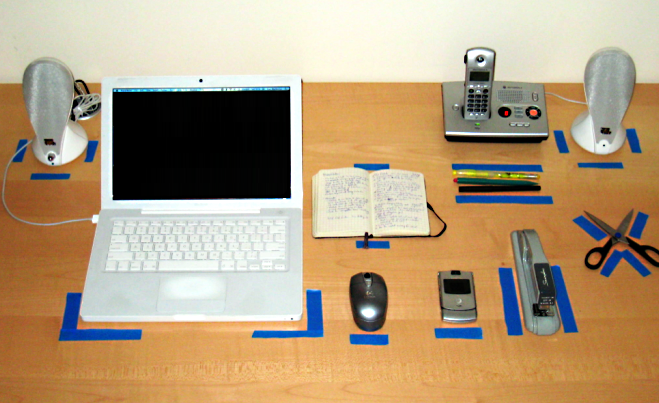
Now that we understand how to implement visual controls, it's time to discuss the benefits of doing so. When it comes to things like 5S and creating visual control, some teams, and particularly type A leaders like myself, may take visual controls a little too far! Once you get on that train, it can be difficult to get off.
You don't need to go as far as taping out your desk! By this point, in my opinion, visual controls have gone from being useful tools to a time-consuming hindrance. On the other hand, many are intimidated by implementing visual controls, probably because their only experience with visualization is in the photo above. YIKES! How can visualization assist us in keeping our standards in check and our processes on track?
Visual Controls: Bringing Standards and Abnormalities to LightAt the heart of lean thinking lies the pursuit of eliminating waste and optimizing processes. Visual controls serve as a cornerstone in achieving these objectives by making key information readily accessible to all stakeholders. Whether through colour-coded labels, Kanban boards, or Andon systems, visual cues provide immediate feedback on the status of operations, enabling quick decision-making and problem-solving.
Enhanced Accountability Visualization promotes accountability by making standards and deviations from them clearly visible to everyone involved in the process. When standards are visually represented, employees have a tangible reference point for their work, reducing ambiguity and ensuring consistency. Likewise, abnormalities are promptly identified through visual cues, prompting swift corrective actions and preventing issues from escalating.
Maintaining Standards and Standardized Work One of the fundamental principles of lean thinking is the establishment of standardized work procedures. Visualization plays a pivotal role in maintaining these standards by providing visual cues that guide employees in performing their tasks consistently and efficiently. By making standardized work visually explicit, organizations mitigate the risk of variation and deviation, ultimately enhancing quality and productivity.
Driving Continuous Improvement Visual controls not only facilitate adherence to existing standards but also serve as a catalyst for continuous improvement. By making abnormalities visible, organizations are prompted to investigate root causes and implement countermeasures to prevent recurrence. Moreover, visualizing key performance metrics and progress toward goals empowers teams to track their performance in real time and identify opportunities for further optimization.
Cultivating a Culture of Excellence
Incorporating visualization into lean practices goes beyond improving operational efficiency—it fosters a culture of excellence and empowerment. When employees can visually see the impact of their actions on performance metrics and outcomes, they feel a sense of ownership and pride in their work. Moreover, the transparency afforded by visual controls promotes collaboration and collective problem-solving, driving organizational success.
The following are case studies showcasing different approaches to implementing visual controls in manufacturing, an office setting, and a web company:
1 Medical: Colour-Coding
Case Study: Family Doctors Office
Implementing visual controls can significantly enhance productivity and quality in a doctor's office. I was pleasantly surprised recently when I went in for my yearly checkup and found that the office had been colour-coded. This particular doctor's office has several different family Doctors, as well as specialized tests and immunizations. Each patient was checked in at the front desk and then assigned a seat colour: blue for sample collection, green for family doctor, and red for bloodwork.
At one glance, it was easy to see how many people were waiting for each procedure, allowing the office to take any additional measures to reduce wait times.
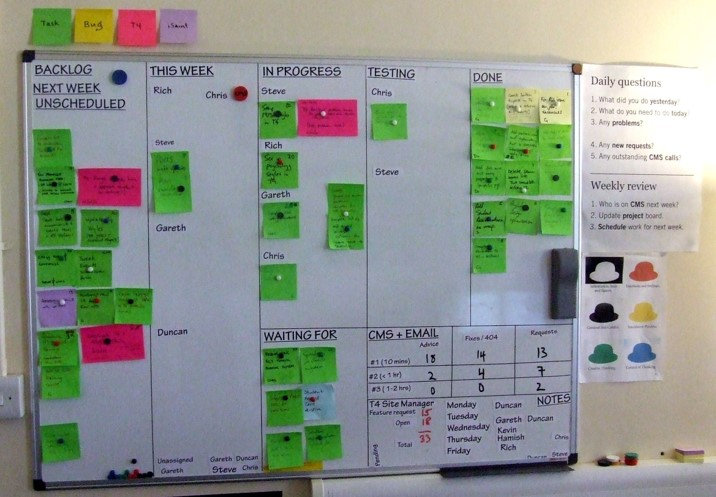
2. Office Setting: Visual Management Boards
Case Study: Marketing Firm
Maintaining visibility and alignment across teams is essential in a marketing firm where multiple projects are ongoing simultaneously. Visual management boards offer a solution by providing a centralized space to display key project metrics, milestones, and task assignments in a visually intuitive format. The marketing firm implements visual management boards prominently displayed in communal team areas. Each board represents a specific project and includes sections for tasks, timelines, and progress updates. Team members use colour-coded sticky notes or magnets to indicate task status, with green representing completed tasks, yellow for in-progress tasks, and red for tasks at risk or delayed. By visualizing project status and performance metrics, teams can quickly identify areas needing attention and take proactive measures to address challenges. Moreover, the transparency afforded by visual management boards fosters communication, collaboration, and accountability among team members, driving project success.
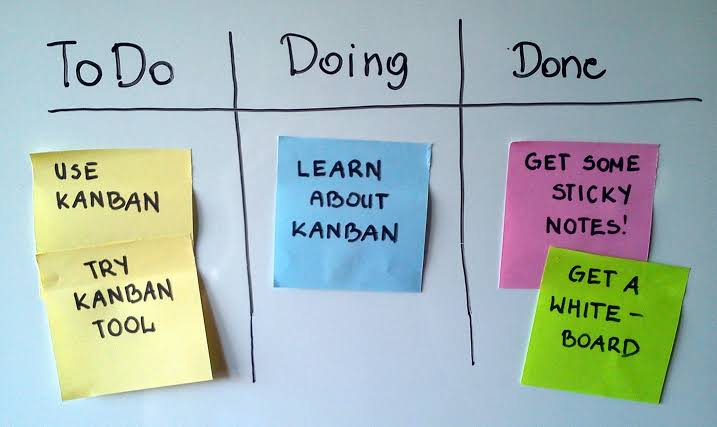
3. Web Company: Kanban System for Software Development
Case Study: Tech Startup Agility and efficiency are critical for staying competitive in a fast-paced web company specializing in software development. Implementing a Kanban system offers an effective way to visualize workflows, manage tasks, and optimize the development process.
The tech startup adopts a Kanban board to track the progress of software development tasks. The board consists of columns representing different stages of the development lifecycle, such as backlog, development, testing, and deployment. Each task is represented by a card colour with relevant details such as task description, assignee, and due date.
Team members move task cards across the board as they progress through the workflow, providing a visual representation of work in progress and bottlenecks. Additionally, colour-coded labels or tags may indicate task priority or type, allowing teams to prioritize and allocate resources effectively.
The concept of visualization is a powerful tool in lean thinking, driving efficiency, accountability, and continuous improvement. By implementing visual controls within processes, organizations make standards and abnormalities visible, fostering transparency and adherence to standardized work. There are numerous ways to implement visual controls, each tailored to the specific needs and dynamics of the environment. For instance, colour coding can help distinguish between items or tasks, while floor markings and signage guide people through spaces and communicate safety information. Checklists and visual work instructions ensure consistency and accuracy, and Kanban systems optimize workflows in various industries. Visual metrics dashboards provide real-time performance tracking and improvement insights. While virtual alternatives exist, traditional whiteboards remain effective due to their constant visibility and tangible presence. Visual controls promote accountability, maintain standards, drive continuous improvement, and cultivate a culture of excellence within organizations. Case studies across manufacturing, office settings, and web companies demonstrate the diverse applications and benefits of visual controls. |
||
|
||
|
||
|
|
|
||
|
We had a great turn-out and received very positive feedback at our last Lunch & Lead Series on the topic of "Leading Problem Solving", however, we also received some comments that it was difficult for those in non-manufacturing spaces to relate to how they can lead problem solving in their area. Over the next few posts, we'll cover off the topics from the Lunch and Lead Series but with a non-manufacturing focus.
If you missed the Lunch & Lead Series, it is available free at our on-line content site here as a “course” but don’t let the terminology fool you, it is just the video recording of the event, divided up into smaller duration “lectures” that correspond to each of the agenda items. Go check it out…
The first topic was the establishment of standards that within a very short period of time, as in a few seconds, anyone can determine if something is normal or abnormal. As in manufacturing, visualization of some standards in non-manufacturing areas are relatively easy. These are the things that when out of standard negatively impact the team’s ability to do their work.
Other examples could be as simple of establishing standards around team supplies, tooling, or equipment.
In non-manufacturing areas the challenge often is that the “work” and “work flow” is not overly visible. For example, an engineering project is comprised of various tasks that engineers need to complete. The challenge here is that often with development type work, the engineers are dealing with a lot of unknowns or because it maybe the first time creating “something” there are no standards for it. In these cases, you want to establish standards around the work flow, provide a framework of generally accepted principles or benchmarks, and provide clear escalation mechanisms when things are not going as expected or planned. An effective way to visualize these is through a visual control board.
In the first example we will use a technical team that is responsible for completing some type of project type work. This could be product design, tooling or test equipment design, or construction/fabrication.
The layout of the board would be done in such a manner as to indicate the tasks that need to be completed by whom within a “standard” period of time. These standards could be industry standards, standard times as determined by the organization, benchmarks, or in the case of creative/innovative never been done before work, best guess estimations or established service level agreements (SLAs). It can also be with reference to the project milestones. Often, there is a strong reluctance to do this because of the “unknowness” of how long it should take to complete these tasks, however, referencing to the milestones allows for faster visibility of potential project delays or impacts. This should not be used to place blame or put undue pressure on those involved, but rather, provide the opportunity for escalation that can lead to additional resources, rescheduling of downstream tasks, and/or important communication of the status of the project to critical stakeholders.
Typically this would be visualized by day for a 1 to 2 week window for each person assigned to the project within a specific team. The board can be either physical or virtual board as long as the task assignments by day by week can be displayed. Each day the board is reviewed by those working on the tasks and their next level up leader. At the daily review, abnormalities to the standards would be very visible indicating a task is behind or that there has been some kind of difficulty or risk associated with it identified.
A pareto of issues can be created and built each day to help the team focus on the biggest issues that impact their work. Often in these types of situations, unplanned work plays a key role and has a significant impact on the teams ability to complete their project(s). Using a different colour sticky in this case to indicate unplanned work is very visual and can easily be tracked in the pareto as an issue. The leader can then assist the team in quickly resolving the issue through problem solving. The problem solving should not occur at the meeting, but rather a commitment made between the appropriate stakeholders as to what the next steps are and by when.
In the second example we’ll review a procurement situation. Typically a procurement team’s work flow is within a computer system. However, critical information is also usually available within those same systems. Again using a visual board and placing critical reports on them with visualization of abnormalities to standards is a good approach. For example, perhaps there are SLAs as to how long it should take for a purchase order (PO) to be placed. An aging report or having each buyer indicate which of their purchase requisitions (PR) are out of that standard helps to visualize purchasing abnormalities. Unfortunately, too often, we can experience payment problems to our vendors and then get ourselves into trouble when they refuse to continue to ship. Then talk about abnormal work to clear that up! Perhaps a metric that shows outstanding payment aging would be beneficial to avoid such situations. Again the abnormalities can be tracked in a form of a pareto for deeper analysis and problem solving. The point is to identify the aspects of the teams workflow that can or is having the biggest impact on their ability to effectively do their job or on the organization.
A third example is for a sales and marketing team. They can visualize their work flow on a visual board and meet daily to review. They could visualize main proposal work content and status. Discuss new risks that arise that may pose a threat to winning the project, as well as visualizing the probability of a win and the financial status of the sales plan vs actual. They can also capture lessons learned to improve their quoting and proposal process to drive continuous improvement, as well as to quickly identify abnormalities or issues that could impact a proposal so that problem solving is quickly initiated and/or escalated. Although non-manufacturing work tasks are less naturally physically visible, the same principles apply.
Controls could include variance to SLAs, escalation mechanisms, layered process audits to confirm standards and identify areas needing focus, for example.
In the next post, we’ll discuss how TIM WOODS can apply to non-manufacturing areas.
|
||
|
||
|
||
|
||
|
|
|
||
|
Visual control boards may not look overly complex, but establishing an effective board and establishing a robust review cadence can be more challenging than initially anticipated. The benefits, however, can be phenomenal! We learned first hand what some of these benefits are during a recent visual control benchmarking gemba.
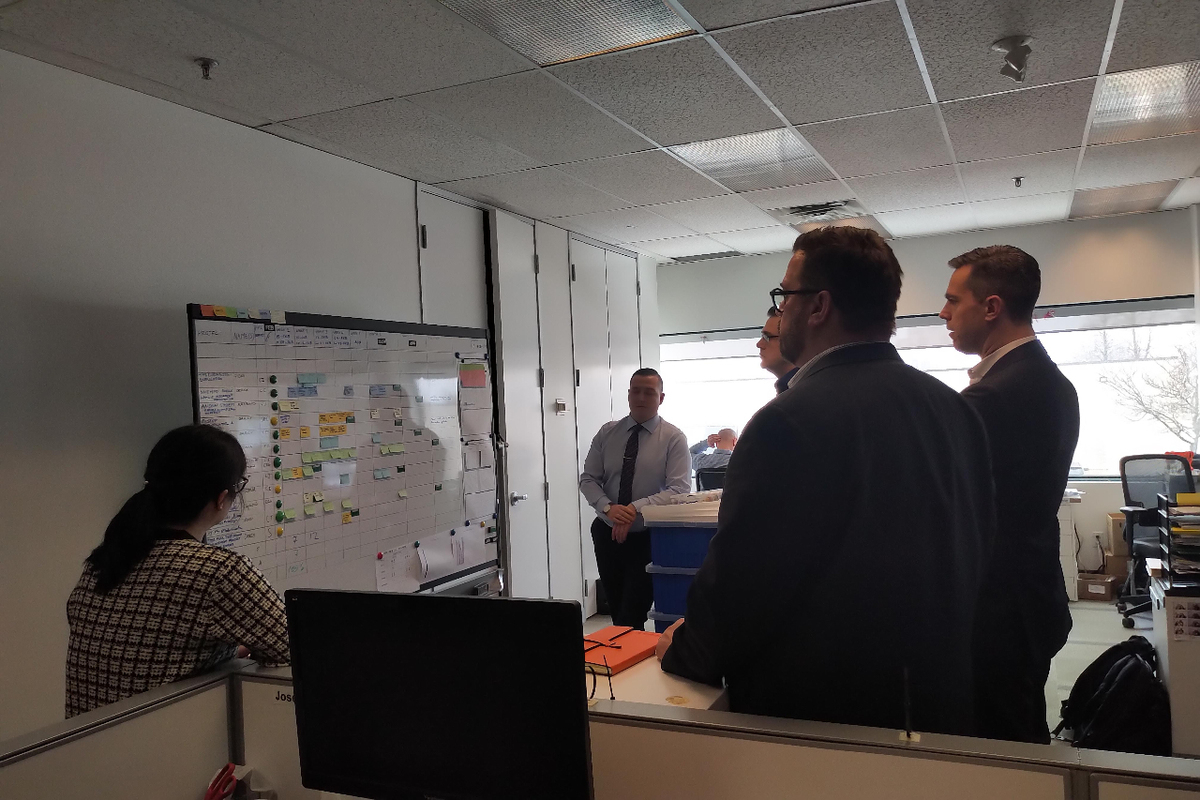
On 12 and 13 February, High Performance Leaders Inc. (HPL) facilitated a visual control board workshop for the Technology Team lead by Travis Vokey, VP and Head of Technology at Dream Unlimited. The first day was a workshop focused on the key attributes of visual control boards, and a working session to begin defining the team's value proposition and key performance metrics. On the second day, there was a benchmarking gemba to Crystal Fountains, Baylis Medical, and Bell Mobility to see and learn first hand from their experiences and existing visual control boards.
Our focus during the benchmarking gemba was to see non-manufacturing areas. Since there can be a stigma that visual control boards are only for manufacturing, we wanted
The Dream team was able to participate in a regular daily huddle in action while at Crystal Fountains. It was fantastic to see and hear the enthusiasm and see the high level of engagement from each of the host company staff members. They were all believers in visual boards. However, that was not always the case. When we asked an engineering team who was the biggest skeptic when they first introduced the boards, an engineer stepped forward and boldly said "Oh, that would have been me!" He went on to explain that he first thought it would just be more work and a waste of time. However, now he admits, the board and the daily huddle has improved communication and work distribution. He's now a believer!
It was motivational to listen to each of the host company staff members talk about what they like about the boards and how they have made their jobs easier, improved team work, and driven solid improvements. Here's some of benefits and results they shared with the Dream team:
At Bell Mobility, the Regional Operations team is involved in over 2,000 projects across the country. Approximately 8 years ago they started tracking key aspects of their projects using typical white board style visual control boards. Then about 3 years ago they implemented digital boards (D-boards) to track and coordinate these massive projects between all stakeholders across the company.
According to Nitin Gautam, Network Access Manager and Robert Dillenbeck, Senior Manager, Territory Operations at Bell Mobility, the D-boards provided certain advantages over the traditional visual control boards including:
In my opinion, D-boards should be implemented with extreme caution. As discussed in a previous article Should Smart Screens Replace Pen & Paper on the Shop Floor?, D-boards can be problematic with potentially lowering visibility if they are not frequently and routinely interacted with becoming nothing more than a information board that over time can become virtually invisible. The most concerning problem though, is that changes to what is tracked and displayed can be slow and costly to revise and continuously improve. So, if D-boards are going to be implemented, be sure to anticipate these problems had have a solid plan to address and overcome them. No doubt they can be powerful and do offer some great benefits, but do watch out for the pitfalls.
The Dream team learned a lot and received some good advice from the 3 host companies. A few of the key points they were advised on included:
|
||
|
||
|
||
|
||
|
|
|
|
HPL Administrator 4 July 11, 2024 |

|
|
Glenn Sommerville 45 June 6, 2024 |


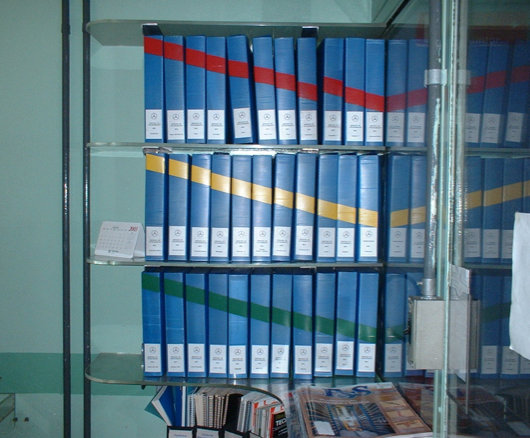 Examples could include a common reference library of regulations, policies, or other documented information. Being able to quickly find what you’re looking for or identifying any that may have been misplaced can prove very helpful, save time, and reduce frustrations. In the virtual world, similar standards are useful for organizing digital storage by establishing standard file structures and nomenclature.
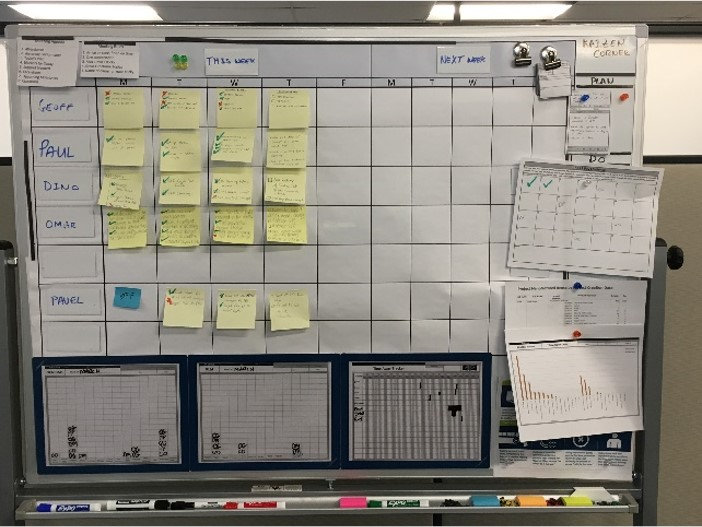
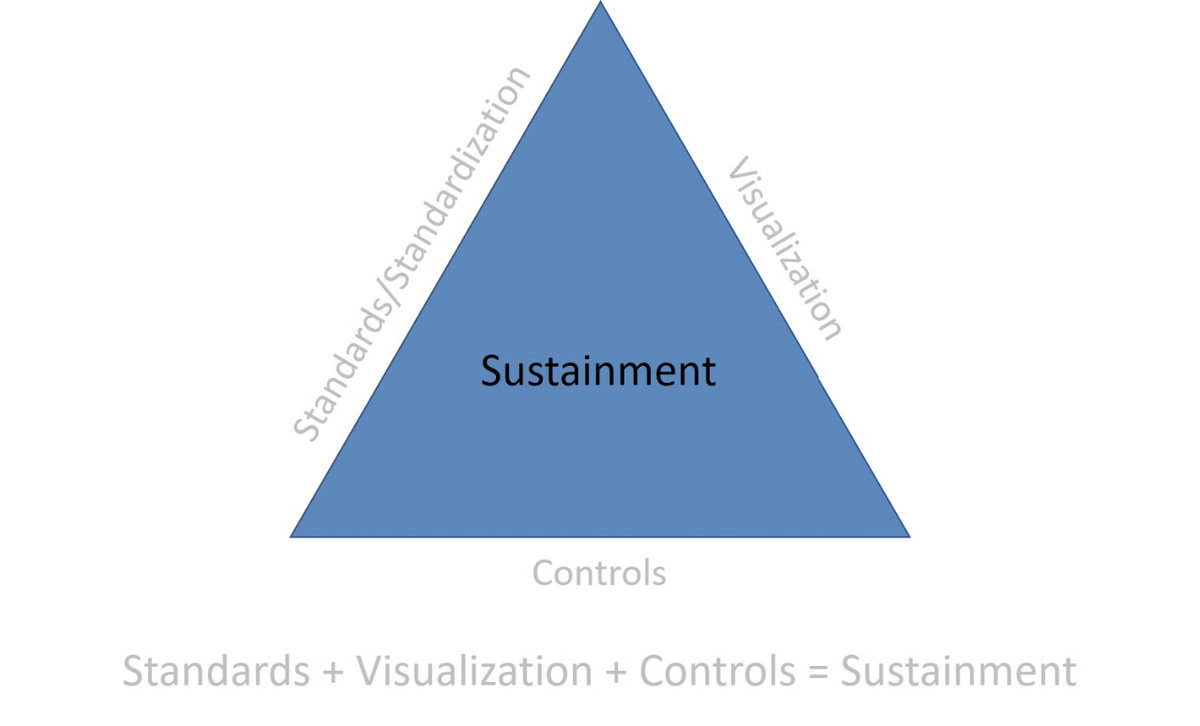 You need to establish the standards the team is to follow, make them visible in some manner usually through a visual board, and then there needs to be some form of controls in place to manage and problem solve through the abnormalities.
 to see how different businesses, industries, and non-manufacturing teams set-up their boards and use them. We saw boards used by Sales & Marketing, Product Design, Process Engineering, Equipment Engineering, Project Management, and yes one from Manufacturing. We reviewed boards at the tier 1, 2, 3, and 4 levels, with tier 1 being at the working staff level and level 4 the organizational level. Each host company had a representative appropriate for each level of board explain how their boards work and how they are used.
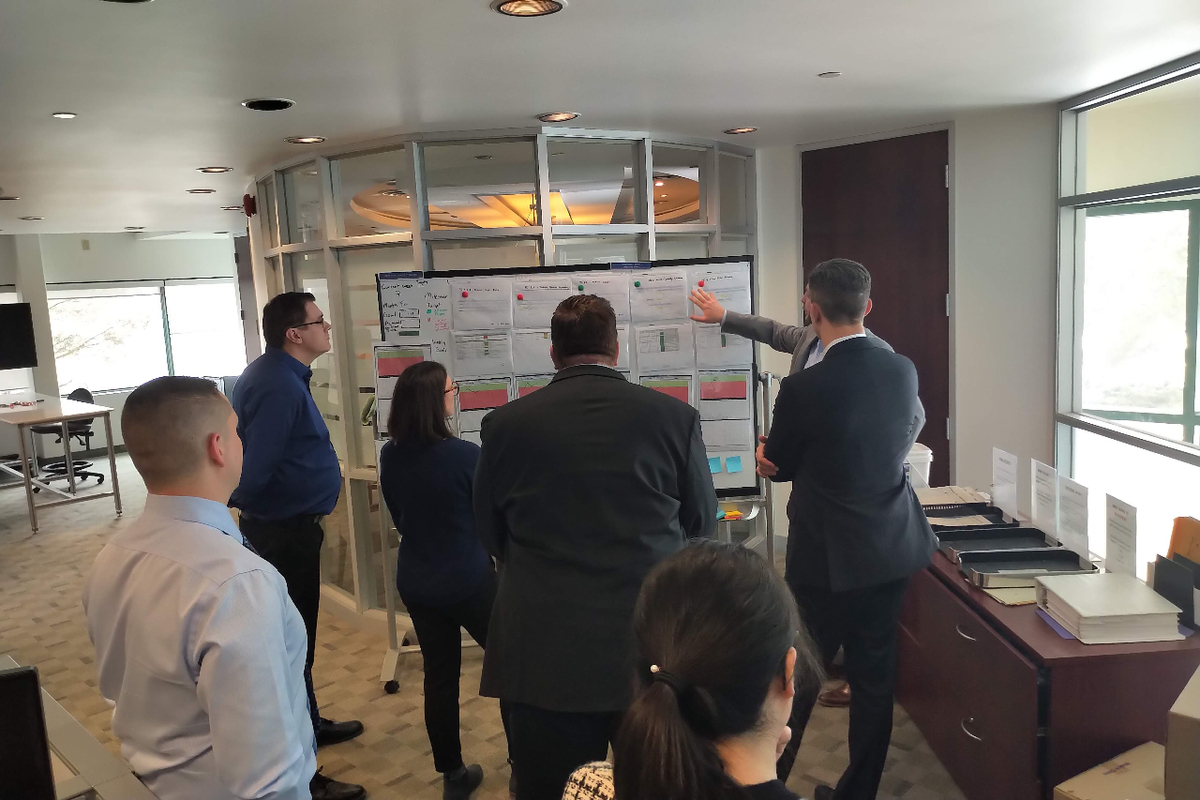
 When properly established, visual control boards add value to both the teams and the leaders.
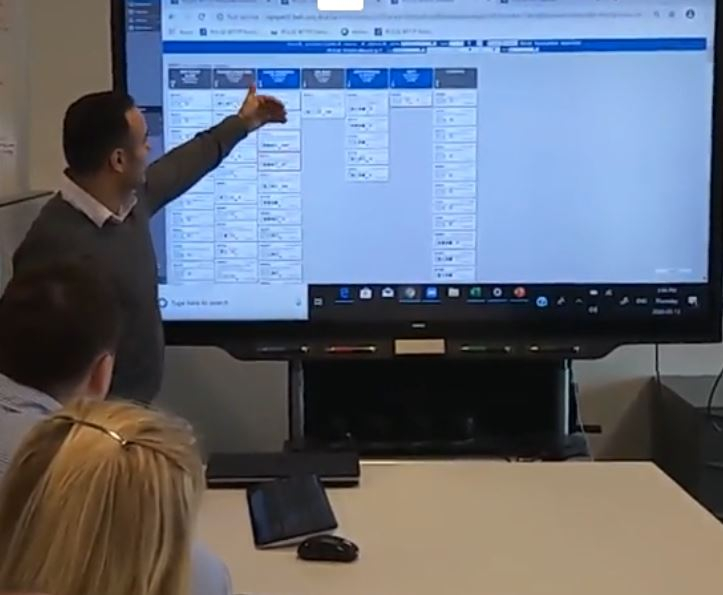
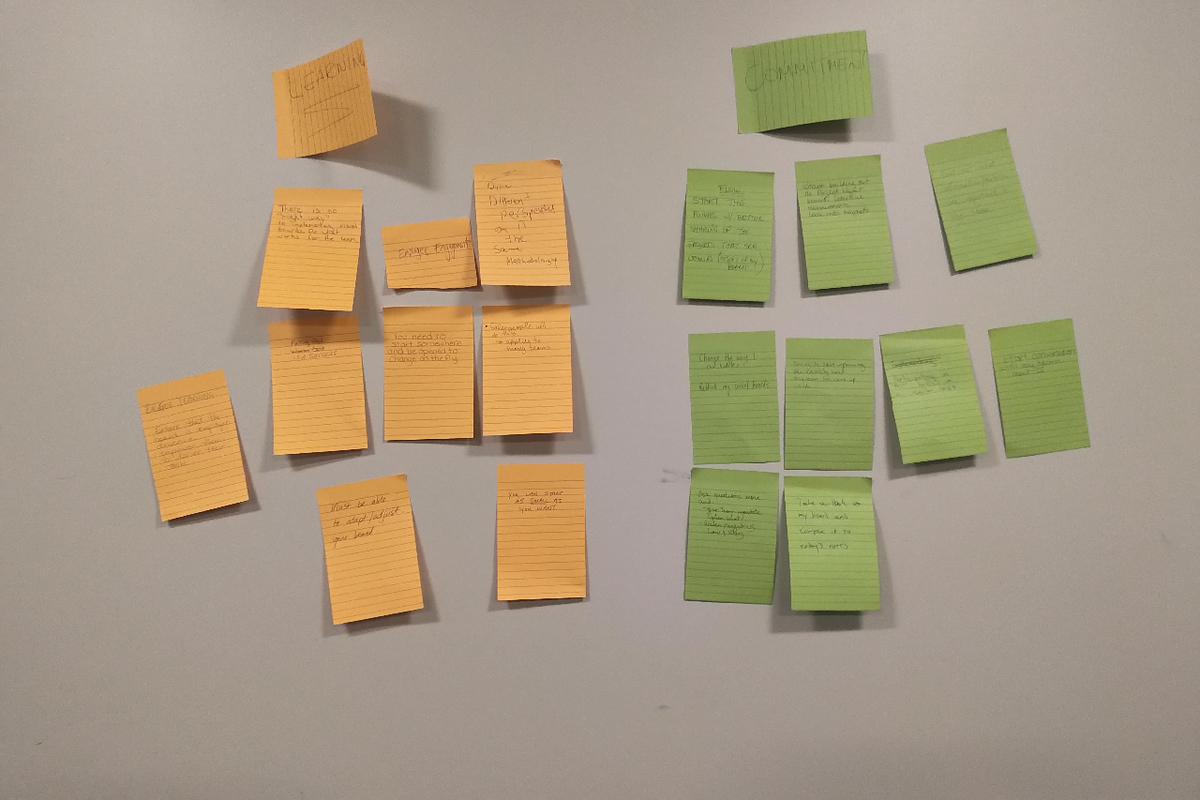 The two day workshop concluded with a Dream debrief where each of the Dream leaders identified the biggest thing that they had learned, and each making a commitment as to what they were going to do when they returned to their office. With the mystery of visual control boards revealed, they are excited to embark on this exciting journey.